
San Cosme metro station
| STC rapid transit | |||||||||||
 | |||||||||||
| General information | |||||||||||
| Location | Avenida Ribera de San Cosme Miguel Hidalgo Mexico City Mexico | ||||||||||
| Coordinates | 19°26′30″N 99°09′40″W / 19.441706°N 99.161096°W | ||||||||||
| Line(s) | |||||||||||
| Platforms | 2 side platforms | ||||||||||
| Tracks | 2 | ||||||||||
| Construction | |||||||||||
| Structure type | Underground | ||||||||||
| History | |||||||||||
| Opened | 14 September 1970 | ||||||||||
| Passengers | |||||||||||
| 2022 | 5,704,555[1] | ||||||||||
| Rank | 70/195[1] | ||||||||||
| Services | |||||||||||
| |||||||||||
| Location | |||||||||||
 Location within Mexico City | |||||||||||
 | |||||||||||
| Area map | |||||||||||
San Cosme is a station on Line 2 of the Mexico City Metro system.[2][3] It is located in the Cuauhtémoc municipality of Mexico City, northwest of the city centre, on Avenue Ribera de San Cosme a few blocks before it becomes Calzada México-Tacuba.[2] The southern exit leads to Colonia San Rafael while the Northern one leads to Colonia Santa María la Ribera.[2] It is two blocks from the Mercado de San Cosme. In 2019, the station had an average ridership of 22,891 passengers per day.[4]
Name and pictogram[edit]
The station name comes from the Ribera de San Cosme avenue, on which the station is located. The former name of the road was Calzada de San Cosme and a stream used to run along the way before the desiccation of Lake Texcoco, hence the name "ribera".[2][5]
The station pictogram depicts a balcony from the nearby colonial building known as La Casa de los Mascarones that currently houses the National Autonomous University of Mexico Foreign Languages School.[2][3]
General information[edit]
The station was opened on 14 September 1970 as part of the second stretch of Line 2, from Pino Suárez to Tacuba.[6]
The station serves the Colonia San Rafael and Colonia Santa María la Ribera neighborhoods.
Ridership[edit]
| Annual passenger ridership | |||||
|---|---|---|---|---|---|
| Year | Ridership | Average daily | Rank | % change | Ref. |
| 2022 | 5,704,555 | 15,628 | 70/195 | +67.42% | [1] |
| 2021 | 3,407,301 | 9,335 | 92/195 | −21.03% | [7] |
| 2020 | 4,314,737 | 11,788 | 82/195 | −48.36% | [8] |
| 2019 | 8,355,454 | 22,891 | 66/195 | +1.14% | [4] |
| 2018 | 8,261,419 | 22,634 | 72/195 | −4.99% | [9] |
| 2017 | 8,694,990 | 23,821 | 62/195 | −7.68% | [10] |
| 2016 | 9,417,922 | 25,732 | 55/195 | −10.08% | [11] |
| 2015 | 10,473,114 | 28,693 | 48/195 | −2.39% | [12] |
| 2014 | 10,729,878 | 29,396 | 46/195 | +4.59% | [13] |
| 2013 | 10,387,074 | 28,457 | 53/195 | +3.79% | [14] |
| 2012 | 9,883,935 | 27,005 | 56/195 | −14.51% | [15] |
| 2011 | 11,561,780 | 31,676 | 46/175 | +55.08% | [16] |
| 2010 | 7,455,453 | 20,425 | 73/175 | – | [17] |
Exits[edit]
- North: Avenida Ribera de San Cosme and Rosas Moreno street, Colonia San Rafael
- South: Avenida Ribera de San Cosme and Naranjo street, Colonia Santa María la Ribera
Gallery[edit]
-
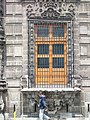 Detail of the Casa de los Mascarones balcony

See also[edit]
References[edit]
- ^ a b c "Afluencia de estación por línea 2022" [Station traffic per line 2022] (in Spanish). Sistema Transporte Colectivo Metro. 2023. Archived from the original on 5 March 2023. Retrieved 5 March 2023.
- ^ a b c d e "San Cosme" (in Spanish). Archived from the original on 28 January 2012. Retrieved 14 August 2011.
- ^ a b Archambault, Richard. "San Cosme » Mexico City Metro System". Retrieved 14 August 2011.
- ^ a b "Afluencia de estación por línea 2019" [Station traffic per line 2019] (in Spanish). Sistema Transporte Colectivo Metro. 2020. Archived from the original on 8 April 2020. Retrieved 3 May 2020.
- ^ "San Cosme" (in Spanish). Metro CDMX. Retrieved 11 May 2020.
- ^ Monroy, Marco. Schwandl, Robert (ed.). "Opening Dates for Mexico City's Subway". Retrieved 14 August 2011.
- ^ "Afluencia de estación por línea 2021" [Station traffic per line 2021] (in Spanish). Sistema Transporte Colectivo Metro. 2022. Archived from the original on 7 March 2022. Retrieved 7 March 2022.
- ^ "Afluencia de estación por línea 2020" [Station traffic per line 2020] (in Spanish). Sistema Transporte Colectivo Metro. 2021. Archived from the original on 21 June 2021. Retrieved 21 June 2021.
- ^ "Afluencia de estación por línea 2018" [Station traffic per line 2018] (in Spanish). Sistema Transporte Colectivo Metro. 2019. Archived from the original on 6 June 2019. Retrieved 7 April 2020.
- ^ "Afluencia de estación por línea 2017" [Station traffic per line 2017] (in Spanish). Sistema Transporte Colectivo Metro. 2019. Archived from the original on 3 May 2020. Retrieved 3 May 2020.
- ^ "Afluencia de estación por línea 2016" [Station traffic per line 2016] (in Spanish). Sistema Transporte Colectivo Metro. 2017. Archived from the original on 3 May 2020. Retrieved 3 May 2020.
- ^ "Afluencia de estación por línea 2015" [Station traffic per line 2015] (in Spanish). Sistema Transporte Colectivo Metro. 2016. Archived from the original on 3 May 2020. Retrieved 6 May 2020.
- ^ "Afluencia de estación por línea 2014" [Station traffic per line 2014] (in Spanish). Sistema Transporte Colectivo Metro. 2015. Archived from the original on 3 May 2020. Retrieved 6 May 2020.
- ^ "Afluencia de estación por línea 2013" [Station traffic per line 2013] (in Spanish). Sistema Transporte Colectivo Metro. 2014. Archived from the original on 3 May 2020. Retrieved 6 May 2020.
- ^ "Afluencia de estación por línea 2012" [Station traffic per line 2012] (in Spanish). Sistema Transporte Colectivo Metro. 2013. Archived from the original on 3 May 2020. Retrieved 6 May 2020.
- ^ "Afluencia de estación por línea 2011" [Station traffic per line 2011] (in Spanish). Sistema Transporte Colectivo Metro. 2012. Archived from the original on 7 May 2020. Retrieved 6 May 2020.
- ^ "Afluencia de estación por línea 2010" [Station traffic per line 2010] (in Spanish). Sistema Transporte Colectivo Metro. 2011. Archived from the original on 7 May 2020. Retrieved 6 May 2020.
External links[edit]
| Line 1 | |
|---|---|
| Line 2 | |
| Line 3 |
|
| Line 4 | |
| Line 5 | |
| Line 6 | |
| Line 7 | |
| Line 8 | |
| Line 9 | |
| Line A | |
| Line B | |
| Line 12 | |
| Authority control databases: Geographic |
|---|