
Orland, California
Orland, California | |
|---|---|
| City of Orland | |
 Orland train station in 1969; now located at the Glenn County Fairgrounds. | |
 Location within Glenn County | |
 Orland Location within California  Orland Location within the United States | |
| Coordinates: 39°44′51″N 122°11′47″W / 39.74750°N 122.19639°W | |
| Country | |
| State | |
| County | Glenn |
| Incorporated | November 11, 1909[1] |
| Area | |
| • Total | 2.98 sq mi (7.72 km2) |
| • Land | 2.98 sq mi (7.72 km2) |
| • Water | 0.00 sq mi (0.00 km2) 0% |
| Elevation | 259 ft (79 m) |
| Population | |
| • Total | 7,622 |
| • Density | 2,600/sq mi (990/km2) |
| Time zone | UTC-8 (Pacific (PST)) |
| • Summer (DST) | UTC-7 (PDT) |
| ZIP code | 95963 |
| Area code | 530 |
| FIPS code | 06-54274 |
| GNIS feature IDs | 1659315, 2411335 |
| Website | Orland, California |
Orland is a city in Glenn County, California. The population as of the 2020 census was 8,298.[5] The population was 7,291 at the 2010 census, up from 6,281 at the 2000 census, making Orland the most populous and fastest growing city in Glenn County. Orland is located 16 miles (26 km) north of Willows,[6] at an elevation of 259 feet (79 m).[3] Interstate 5, (north–south) passes west of the downtown area while State Route 32 (east–west) passes through downtown.
A member of Bee City USA, Orland is the "Queen Bee Capital of North America" owing to its robust local and regional queen bee production as part of the county's agricultural products. It is home of the Honeybee Discovery Center museum.[7] Annual events include the Queen Bee Festival in June and OktoBEEfest in October.
Geography[edit]
According to the United States Census Bureau, the city has a total area of 3.0 square miles (7.8 km2), all of it land.
Orland is a rural agricultural town that sits in the northern Sacramento Valley. Interstate 5 is just west of the town.
The Sacramento River runs 10 miles (16 km) East of Orland and Black Butte Lake sits 8 miles (13 km) West. The Black Butte Lake dam drains into Stony Creek, which flows about a half-mile north of the Orland Arch.
Climate[edit]
According to the Köppen Climate Classification system, Orland has a warm-summer Mediterranean climate, abbreviated "Csa" on climate maps.[8]
| Climate data for Orland, California, 1991–2020 normals, extremes 1903–present | |||||||||||||
|---|---|---|---|---|---|---|---|---|---|---|---|---|---|
| Month | Jan | Feb | Mar | Apr | May | Jun | Jul | Aug | Sep | Oct | Nov | Dec | Year |
| Record high °F (°C) | 81 (27) |
84 (29) |
89 (32) |
98 (37) |
110 (43) |
115 (46) |
120 (49) |
120 (49) |
114 (46) |
105 (41) |
95 (35) |
81 (27) |
120 (49) |
| Mean maximum °F (°C) | 69.7 (20.9) |
74.6 (23.7) |
81.0 (27.2) |
89.2 (31.8) |
96.4 (35.8) |
104.5 (40.3) |
106.6 (41.4) |
104.6 (40.3) |
103.2 (39.6) |
94.1 (34.5) |
79.8 (26.6) |
68.2 (20.1) |
108.7 (42.6) |
| Mean daily maximum °F (°C) | 56.8 (13.8) |
61.8 (16.6) |
66.9 (19.4) |
73.1 (22.8) |
81.1 (27.3) |
88.8 (31.6) |
94.1 (34.5) |
93.1 (33.9) |
90.0 (32.2) |
79.5 (26.4) |
65.3 (18.5) |
56.5 (13.6) |
75.6 (24.2) |
| Daily mean °F (°C) | 47.3 (8.5) |
50.9 (10.5) |
55.0 (12.8) |
59.9 (15.5) |
67.2 (19.6) |
74.5 (23.6) |
78.8 (26.0) |
77.1 (25.1) |
73.9 (23.3) |
65.1 (18.4) |
53.9 (12.2) |
46.9 (8.3) |
62.5 (17.0) |
| Mean daily minimum °F (°C) | 37.7 (3.2) |
40.1 (4.5) |
43.0 (6.1) |
46.6 (8.1) |
53.3 (11.8) |
60.2 (15.7) |
63.4 (17.4) |
61.0 (16.1) |
57.7 (14.3) |
50.7 (10.4) |
42.5 (5.8) |
37.3 (2.9) |
49.5 (9.7) |
| Mean minimum °F (°C) | 28.8 (−1.8) |
31.4 (−0.3) |
34.4 (1.3) |
36.4 (2.4) |
43.3 (6.3) |
50.4 (10.2) |
55.8 (13.2) |
54.1 (12.3) |
50.1 (10.1) |
42.2 (5.7) |
32.8 (0.4) |
28.0 (−2.2) |
25.8 (−3.4) |
| Record low °F (°C) | 17 (−8) |
19 (−7) |
24 (−4) |
27 (−3) |
31 (−1) |
41 (5) |
45 (7) |
43 (6) |
39 (4) |
29 (−2) |
21 (−6) |
15 (−9) |
15 (−9) |
| Average precipitation inches (mm) | 4.50 (114) |
4.11 (104) |
2.79 (71) |
1.37 (35) |
1.13 (29) |
0.38 (9.7) |
0.02 (0.51) |
0.08 (2.0) |
0.24 (6.1) |
0.91 (23) |
2.04 (52) |
3.82 (97) |
21.39 (543.31) |
| Average precipitation days (≥ 0.01 in) | 11.6 | 9.5 | 8.7 | 5.7 | 4.2 | 1.4 | 0.2 | 0.4 | 0.9 | 3.5 | 6.7 | 10.5 | 63.3 |
| Source 1: NOAA[9] | |||||||||||||
| Source 2: National Weather Service[10] | |||||||||||||
History[edit]
Orland incorporated in 1909.[6] The first post office in Orland opened in 1916.[6]
In 1908 Orland was the namesake of one of the first irrigation projects of the newly formed United States Bureau of Reclamation, the Orland Project, authorized by the Newlands Reclamation Act. The 1910 East Park Dam and other area dams still provide agricultural irrigation water.
During World War II, Orland was selected by the United States Army as the location for an airfield that was used for training pilots. Aircraft used at Orland included the Boeing B-17 Flying Fortress. Scenes for several films used for training pilots and aircrew members were produced at Orland. Constructed of a large square of thick, reinforced concrete, most of the airfield is now a civil airport operated by Glenn County.
Orland station was a stop along the Southern Pacific railroad's West Valley Line, now known as the California Northern Railroad.[11] The Amtrak Coast Starlight route, running daily from Los Angeles to Seattle,[12] served the town from 1974 to 1982.[13]
In 2017 the City Council affiliated the city with Bee City USA and declared itself "Queen Bee Capital of North America" due to the unmatched production of queen bees by locally owned commercial apiaries.
Demographics[edit]
| Census | Pop. | Note | %± |
|---|---|---|---|
| 1880 | 292 | — | |
| 1890 | 440 | 50.7% | |
| 1910 | 836 | — | |
| 1920 | 1,582 | 89.2% | |
| 1930 | 1,195 | −24.5% | |
| 1940 | 1,366 | 14.3% | |
| 1950 | 2,067 | 51.3% | |
| 1960 | 2,534 | 22.6% | |
| 1970 | 2,884 | 13.8% | |
| 1980 | 4,031 | 39.8% | |
| 1990 | 5,052 | 25.3% | |
| 2000 | 6,281 | 24.3% | |
| 2010 | 7,291 | 16.1% | |
| 2020 | 7,622 | 4.5% | |
| U.S. Decennial Census[4] | |||
2010[edit]
At the 2010 census Orland had a population of 7,291. The population density was 2,453.8 inhabitants per square mile (947.4/km2). The racial makeup of Orland was 4,828 (66.2%) White, 37 (0.5%) African American, 122 (1.7%) Native American, 208 (2.9%) Asian, 1 (0.0%) Pacific Islander, 1,833 (25.1%) from other races, and 262 (3.6%) from two or more races. Hispanic or Latino of any race were 3,269 persons (44.8%).[15]
The census reported that 7,280 people (99.8% of the population) lived in households, 6 (0.1%) lived in non-institutionalized group quarters, and 5 (0.1%) were institutionalized.
There were 2,515 households, 1,074 (42.7%) had children under the age of 18 living in them, 1,280 (50.9%) were opposite-sex married couples living together, 377 (15.0%) had a female householder with no husband present, 147 (5.8%) had a male householder with no wife present. There were 191 (7.6%) unmarried opposite-sex partnerships, and 7 (0.3%) same-sex married couples or partnerships. 583 households (23.2%) were one person and 272 (10.8%) had someone living alone who was 65 or older. The average household size was 2.89. There were 1,804 families (71.7% of households); the average family size was 3.42.
The age distribution was 2,209 people (30.3%) under the age of 18, 742 people (10.2%) aged 18 to 24, 1,875 people (25.7%) aged 25 to 44, 1,608 people (22.1%) aged 45 to 64, and 857 people (11.8%) who were 65 or older. The median age was 32.0 years. For every 100 females, there were 96.6 males. For every 100 females age 18 and over, there were 92.1 males.
There were 2,659 housing units at an average density of 894.9 per square mile (345.5/km2), of which 2,515 were occupied, 1,459 (58.0%) by the owners and 1,056 (42.0%) by renters. The homeowner vacancy rate was 2.2%; the rental vacancy rate was 3.5%. 4,235 people (58.1% of the population) lived in owner-occupied housing units and 3,045 people (41.8%) lived in rental housing units.
2000[edit]
As of the 2000 census,[16] there were 6,281 people in 2,190 households, including 1,568 families, in the city. The population density was 2,481.2 inhabitants per square mile (958.0/km2). There were 2,309 housing units at an average density of 912.1 per square mile (352.2/km2). The racial makeup of the city was 59.87% White, 0.59% Black or African American, 1.56% Native American, 1.89% Asian, 0.18% Pacific Islander, 24.10% from other races, and 3.81% from two or more races. 45.26% of the population were Hispanic or Latino of any race.
Of the 2,190 households 41.2% had children under the age of 18 living with them, 50.6% were married couples living together, 13.9% had a female householder with no husband present, and 28.4% were non-families. 23.3% of households were one person and 12.9% were one person aged 65 or older. The average household size was 2.86 and the average family size was 3.36.
The age distribution was 32.6% under the age of 18, 9.8% from 18 to 24, 27.4% from 25 to 44, 17.1% from 45 to 64, and 13.2% 65 or older. The median age was 31 years. For every 100 females, there were 96.6 males. For every 100 females age 18 and over, there were 93.3 males.
The median income for a household in the city was $27,973, and the median family income was $32,792. Males had a median income of $30,268 versus $21,625 for females. The per capita income for the city was $12,486. About 12.7% of families and 19.0% of the population were below the poverty line, including 25.2% of those under age 18 and 6.7% of those age 65 or over.
Politics[edit]
In the state legislature, Orland is in the 4th Senate District, represented by Democrat Marie Alvarado-Gil,[17] and in the 3rd Assembly District, represented by Republican James Gallagher.[18]
Federally, Orland is in California's 3rd congressional district, represented by Republican Kevin Kiley.[19]
Education[edit]
- Public schools
- Fairview Elementary
- Mill Street Elementary
- C.K. Price Middle School
- Orland High School
- North Valley Continuation High School
- Private schools
- North Valley Christian School
Views[edit]
-
 Welcome signs
 -
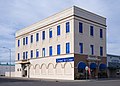
 City Hall and Police Station
 -
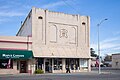
 Masonic Temple
 -
 Odd Fellows Building
 -
 First Lutheran Church


Notable people[edit]
- Mark Koenig, infielder and teammate of Babe Ruth and Lou Gehrig with the New York Yankees, was living in Orland at the time of his death in 1993.
- Aldrick Rosas, NFL placekicker for the New York Giants, was born and raised in Orland.
- Cal Worthington, automobile mogul, owned a 24,000-acre ranch here and died in Orland at age 92.
- George Wright, organist, was born in Orland.
- Jackson Pollock, painter, lived on the outskirts of Orland for a short while growing up.
References[edit]
- ^ "California Cities by Incorporation Date". California Association of Local Agency Formation Commissions. Archived from the original (Word) on October 17, 2013. Retrieved April 7, 2013.
- ^ "2019 U.S. Gazetteer Files". United States Census Bureau. Retrieved July 1, 2020.
- ^ a b "Orland". Geographic Names Information System. United States Geological Survey, United States Department of the Interior.
- ^ a b "Census of Population and Housing". Census.gov. Retrieved June 4, 2021.
- ^ "U.S. Census Bureau QuickFacts: Orland city, California". www.census.gov. Retrieved June 9, 2023.
- ^ a b c Durham, David L. (1998). California's Geographic Names: A Gazetteer of Historic and Modern Names of the State. Clovis, Calif.: Word Dancer Press. p. 288. ISBN 1-884995-14-4.
- ^ "Honeybee Discovery Center". Retrieved February 23, 2023.
- ^ Climate Summary for Orland, California
- ^ "U.S. Climate Normals Quick Access – Station: Orland, CA". National Oceanic and Atmospheric Administration. Retrieved February 20, 2023.
- ^ "NOAA Online Weather Data – NWS Sacramento". National Weather Service. Retrieved February 20, 2023.
- ^ "Time Tables" (PDF). Southern Pacific. January 15, 1954. Retrieved June 5, 2020.
- ^ "Amtrak National Train Timetables". The Museum of Railway Timetables. Amtrak. October 25, 1981. p. 50. Retrieved May 23, 2020.
- ^ "1982 Amtrak Coast Starlight timetable". The Museum of Railway Timetables. Amtrak. April 25, 1982. p. 46. Retrieved May 23, 2020.
- ^ "Population and Housing Unit Estimates". United States Census Bureau. May 24, 2020. Retrieved May 27, 2020.
- ^ "2010 Census Interactive Population Search: CA - Orland city". U.S. Census Bureau. Archived from the original on July 15, 2014. Retrieved July 12, 2014.
- ^ "U.S. Census website". United States Census Bureau. Retrieved January 31, 2008.
- ^ "Senators". State of California. Retrieved April 6, 2013.
- ^ "Members Assembly". State of California. Retrieved April 6, 2013.
- ^ "California's 3rd Congressional District - Representatives & District Map". Civic Impulse, LLC. Retrieved March 1, 2013.
External links[edit]
- Orland Chamber of Commerce
- Images of Orland from the Eastman’s Originals Collection, Special Collections Dept., University of California, Davis.
Municipalities and communities of Glenn County, California, United States | ||
|---|---|---|
| Cities |  | |
| CDPs | ||
| Unincorporated communities | ||
| Indian reservations | ||
| Ghost towns | ||
| International | |
|---|---|
| National | |
| Geographic | |
| Other | |