Saikai, Nagasaki
Saikai
西海市 | |
|---|---|
 Saikai City Hall | |
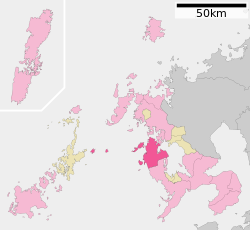
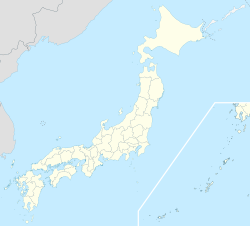
 Location of Saikai in Nagasaki Prefecture | |
| Coordinates: 32°56′N 129°39′E / 32.933°N 129.650°E | |
| Country | Japan |
| Region | Kyushu |
| Prefecture | Nagasaki Prefecture |
| Area | |
| • Total | 242.01 km2 (93.44 sq mi) |
| Population (March 31, 2017) | |
| • Total | 28,815 |
| • Density | 120/km2 (310/sq mi) |
| Time zone | UTC+09:00 (JST) |
| City hall address | 857-2302 |
| Climate | Cfa |
| Website | www |
| Symbols | |
| Bird | Japanese bush warbler |
| Fish | Sebastiscus marmoratus |
| Flower | Hibiscus hamabo |
| Tree | Hibiscus hamabo |
Saikai (西海市, Saikai-shi) is a city located in Nagasaki Prefecture, Japan. As of March 2017, the city has an estimated population of 28,815 and a population density of 4,700 persons per km2. The total area is 242.01 km2.[1]
The modern city of Saikai was established on April 1, 2005, from the merger of five towns on the northern tip of Nishisonogi Peninsula: the former town of Saikai, Ōseto, Ōshima, Sakito and Seihi (all from Nishisonogi District). Its city hall is the former town hall of Ōseto.
The economy of the towns in this area were dominated by fishing and whaling in the Edo period, and coal mining in the Meiji period. The area is now primarily agricultural, with forestry products and tourism also of importance.
However, on Oshima island, north of Saikai and close to Sasebo, a large shipyard is active building bulk ships and metal structures, i.e. Oshima Shipbuilding, in which the Sumitomo Heavy Industries has shares.
Geography[edit]
Climate[edit]
Saikai has a humid subtropical climate (Köppen:Cfa) with hot summers and cool winters. The average annual temperature in Saikai is 16.6 °C (61.9 °F). The average annual rainfall is 1,710.7 mm (67.35 in) with June as the wettest month. The temperatures are highest on average in August, at around 26.7 °C (80.1 °F), and lowest in January, at around 7.4 °C (45.3 °F).[2] Its record high is 36.7 °C (98.1 °F), reached on 21 August 2018, and its record low is −3.4 °C (25.9 °F), reached on 26 February 1981.[3]
| Climate data for Oseto, Saikai (1991−2020 normals, extremes 1977−present) | |||||||||||||
|---|---|---|---|---|---|---|---|---|---|---|---|---|---|
| Month | Jan | Feb | Mar | Apr | May | Jun | Jul | Aug | Sep | Oct | Nov | Dec | Year |
| Record high °C (°F) | 20.7 (69.3) |
21.9 (71.4) |
23.7 (74.7) |
27.0 (80.6) |
29.3 (84.7) |
34.2 (93.6) |
36.5 (97.7) |
36.7 (98.1) |
36.2 (97.2) |
30.8 (87.4) |
25.7 (78.3) |
22.5 (72.5) |
36.7 (98.1) |
| Mean daily maximum °C (°F) | 10.4 (50.7) |
11.6 (52.9) |
14.8 (58.6) |
19.0 (66.2) |
22.3 (72.1) |
24.9 (76.8) |
28.5 (83.3) |
30.2 (86.4) |
27.5 (81.5) |
23.0 (73.4) |
17.8 (64.0) |
12.8 (55.0) |
20.2 (68.4) |
| Daily mean °C (°F) | 7.4 (45.3) |
8.0 (46.4) |
10.8 (51.4) |
14.8 (58.6) |
18.4 (65.1) |
21.6 (70.9) |
25.4 (77.7) |
26.7 (80.1) |
23.6 (74.5) |
19.1 (66.4) |
14.3 (57.7) |
9.5 (49.1) |
16.6 (61.9) |
| Mean daily minimum °C (°F) | 4.6 (40.3) |
4.8 (40.6) |
7.2 (45.0) |
11.1 (52.0) |
15.0 (59.0) |
19.0 (66.2) |
23.3 (73.9) |
24.1 (75.4) |
20.8 (69.4) |
16.0 (60.8) |
11.2 (52.2) |
6.5 (43.7) |
13.6 (56.5) |
| Record low °C (°F) | −2.7 (27.1) |
−3.4 (25.9) |
−2.9 (26.8) |
3.2 (37.8) |
8.1 (46.6) |
12.1 (53.8) |
15.6 (60.1) |
18.6 (65.5) |
12.8 (55.0) |
6.6 (43.9) |
2.9 (37.2) |
−1.1 (30.0) |
−3.4 (25.9) |
| Average precipitation mm (inches) | 63.3 (2.49) |
72.9 (2.87) |
114.3 (4.50) |
142.7 (5.62) |
152.6 (6.01) |
268.3 (10.56) |
262.0 (10.31) |
197.4 (7.77) |
178.5 (7.03) |
98.1 (3.86) |
100.8 (3.97) |
78.6 (3.09) |
1,710.7 (67.35) |
| Average precipitation days (≥ 1.0 mm) | 9.1 | 8.6 | 10.5 | 9.4 | 9.2 | 13.1 | 10.7 | 9.6 | 9.4 | 5.8 | 8.4 | 8.5 | 112.3 |
| Mean monthly sunshine hours | 104.2 | 131.1 | 176.6 | 199.1 | 207.9 | 140.1 | 178.3 | 231.0 | 198.5 | 202.2 | 150.6 | 116.1 | 2,039.2 |
| Source: Japan Meteorological Agency[3][2] | |||||||||||||
Demographics[edit]
Per Japanese census data, the population of Saikai in 2020 is 26,275 people.[4] Saikai has been conducting censuses since 1920. The city's population peaked in the 1950s with more than 80,000 people. However, since 1960, Saikai's population has fallen sharply, and in the 1970s it was half what it was 10 years ago; by 2020, the population will be only a third of what it was in the 1950s.
| Year | Pop. | ±% |
|---|---|---|
| 1920 | 63,605 | — |
| 1925 | 61,263 | −3.7% |
| 1930 | 63,802 | +4.1% |
| 1935 | 57,938 | −9.2% |
| 1940 | 61,639 | +6.4% |
| 1945 | 73,144 | +18.7% |
| 1950 | 80,999 | +10.7% |
| 1955 | 84,161 | +3.9% |
| 1960 | 80,784 | −4.0% |
| 1965 | 60,591 | −25.0% |
| 1970 | 42,769 | −29.4% |
| 1975 | 41,941 | −1.9% |
| 1980 | 41,064 | −2.1% |
| 1985 | 39,670 | −3.4% |
| 1990 | 37,610 | −5.2% |
| 1995 | 36,327 | −3.4% |
| 2000 | 35,288 | −2.9% |
| 2005 | 33,680 | −4.6% |
| 2010 | 31,183 | −7.4% |
| 2015 | 28,691 | −8.0% |
| 2020 | 26,275 | −8.4% |
| Saikai population statistics[4] | ||
References[edit]
- ^ "Official website of Saikai city" (in Japanese). Japan: Saikai City. Retrieved 26 April 2017.
- ^ a b 気象庁 / 平年値(年・月ごとの値). JMA. Retrieved March 30, 2022.
- ^ a b 観測史上1~10位の値(年間を通じての値). JMA. Retrieved March 30, 2022.
- ^ a b Saikai population statistics
External links[edit]
 Media related to Saikai, Nagasaki at Wikimedia Commons
- Saikai City official website (in Japanese)


